
In a marketing campaign we always need to measure the performance. This is typically done by looking at the performance difference of target and control group.
To effectively measure success, the business stakeholder will probably tell you about a few metrics they are interested about. However, it is up to the data scientist/analyst to set-up the experiment in a way that allows a statistically meaningful measurement. This needs to be done before launching the campaign. In many cases, I have seen the business stakeholder and campaign developers launching the campaign without consulting the data analyst/scientist, and they are only consulted when the business wanted to understand how their campaign is performing. Often, the campaign design is not ideal for measurements and the analysts need to cut corners and/or put a lot of caveats in their report.
To avoid these issues, please make sure the experiment design process is followed during campaign development. I am going to briefly summarize the process below.
Experiment design in a marketing campaign
A marketing campaign is a form of A/B or A/B/C testing. It needs at least two groups: (1) target: who we contact from the campaign (aka who gets the treatment/offer) (2) control: who we don’t contact
It is very important that target and control comes from the same population. In other words, both target and control needs to meet the eligibility/inclusion criteria for the campaign. They should only differ by the contact (or lack thereof) from the campaign.
It is also of paramount importance that control group is large enough to guarantee a statistically significant outcome (be it positive or negative). This depends on a few things:
- The population size (aka how many customer/accounts meet the eligibility criteria)
- What is the expected conversion rate in the control group (example: how many control customers, out of 100, are likely to apply for a home loan even if we don’t contact them)?
- What is the minimum improvement we should see in the target group? Please note, this is not the same as the expected conversion rate. Rather, it is the minimum increase one should rationally/logically see in the success metric based on the nature of the campaign (aka it’s offer/proposition). Any improvement below this threshold will not be reliably detected in the measurement/PIR (post implementation review). Often, this comes from the business stakeholder and the hardest part.
Here’s an example:
Let’s say we work for a bank that offers home loans/mortgages. It offers both fixed rate mortgages and variable rate mortgages. Let’s say we want to run a campaign targeting the variable rate cohort where the customer has a minimum deposit of $50k in their savings account. The campaign will attempt to encourage these customers to apply for a new home loan with our bank (which we often refer to as the treatment from the campaign). Then:
- Step-1: We find there are 2,000 customers eligible for this campaign.
- Step-2: Historically, we know ~4% customers with over $50k in their savings account applies for a home loan within 3 months of reaching that $50k savings. This will be used as the expected conversion rate in the control group. Typically we get this information by looking into historical data.
- Step-3: Now we estimate, based on reasoning - not data, what should be the minimum increase in the home loans application rate given we’re asking them to apply for a home loan with our bank (i.e. in the target group). This is often the hardest part to justify and almost always need involvement from business stakeholders. For the purpose of this example, let’s say this to be 8%.
Once we know these 3 numbers, let’s calculate a few more:
Let’s assume we will do a 5% split (i.e. 5% of the eligible population will go to the control group whereas 95% will be contacted from the campaign).
Initial size for the target group: 95% of 2,000 (from Step-1) = 1,900 customers
Initial size for the control group: 5% of 2,000 = 100 customers
Proportion for the target group: 8% of 1,900 (from Step-3) = 152 customers
Proportion for the control group: 4% of 100 (from Step-2) = 4 customers
Calculate the statistical significance using a calculator (no point doing that manually). Use numbers for the calculated proportions and size for both groups from above. An example calculator can be found here: https://www.surveymonkey.com/mp/ab-testing-significance-calculator/ . In our case, the result is the following:
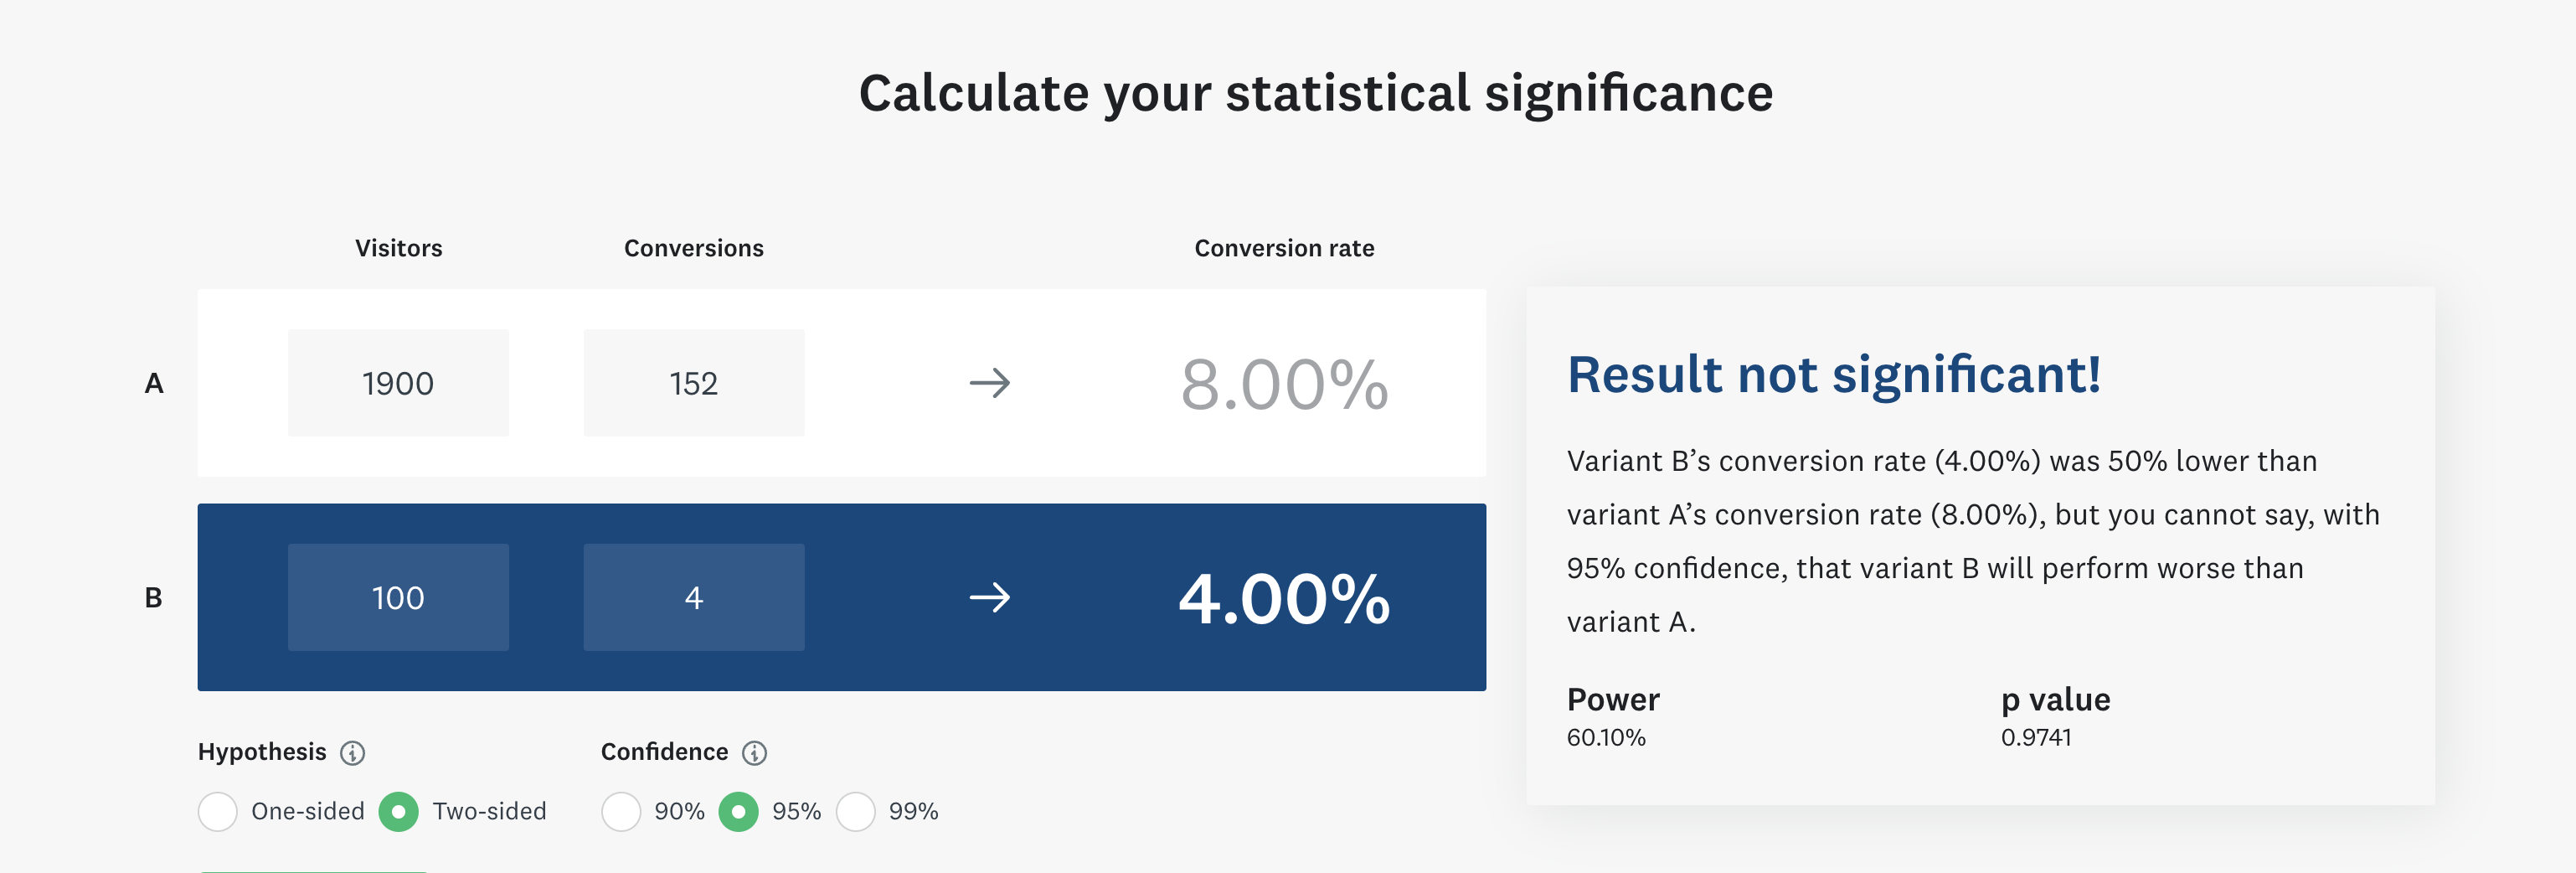
Clearly, the result is not statistically significant. This means we cannot reliably detect a 4% difference between target and control group with our sample size if we put only 5% in the control group.
To fix that, we either need to assume the minimum logical difference between target and control is higher, or we need to increase the control group size. The latter is much easier in practice.
Let’s say, for the purpose of illustration in this example, we now allocate 10% in the control group (i.e. 10% of 2,000 = 200 customers). Therefore, we now have 1,800 customers in the target and 200 in the control group.
With the assumed performance in the target and control group, proportions for target is now 8% of 1,800 = 144. Similarly, control proportion is 4% of 200 = 8
Let’s input the numbers in the online calculator again:
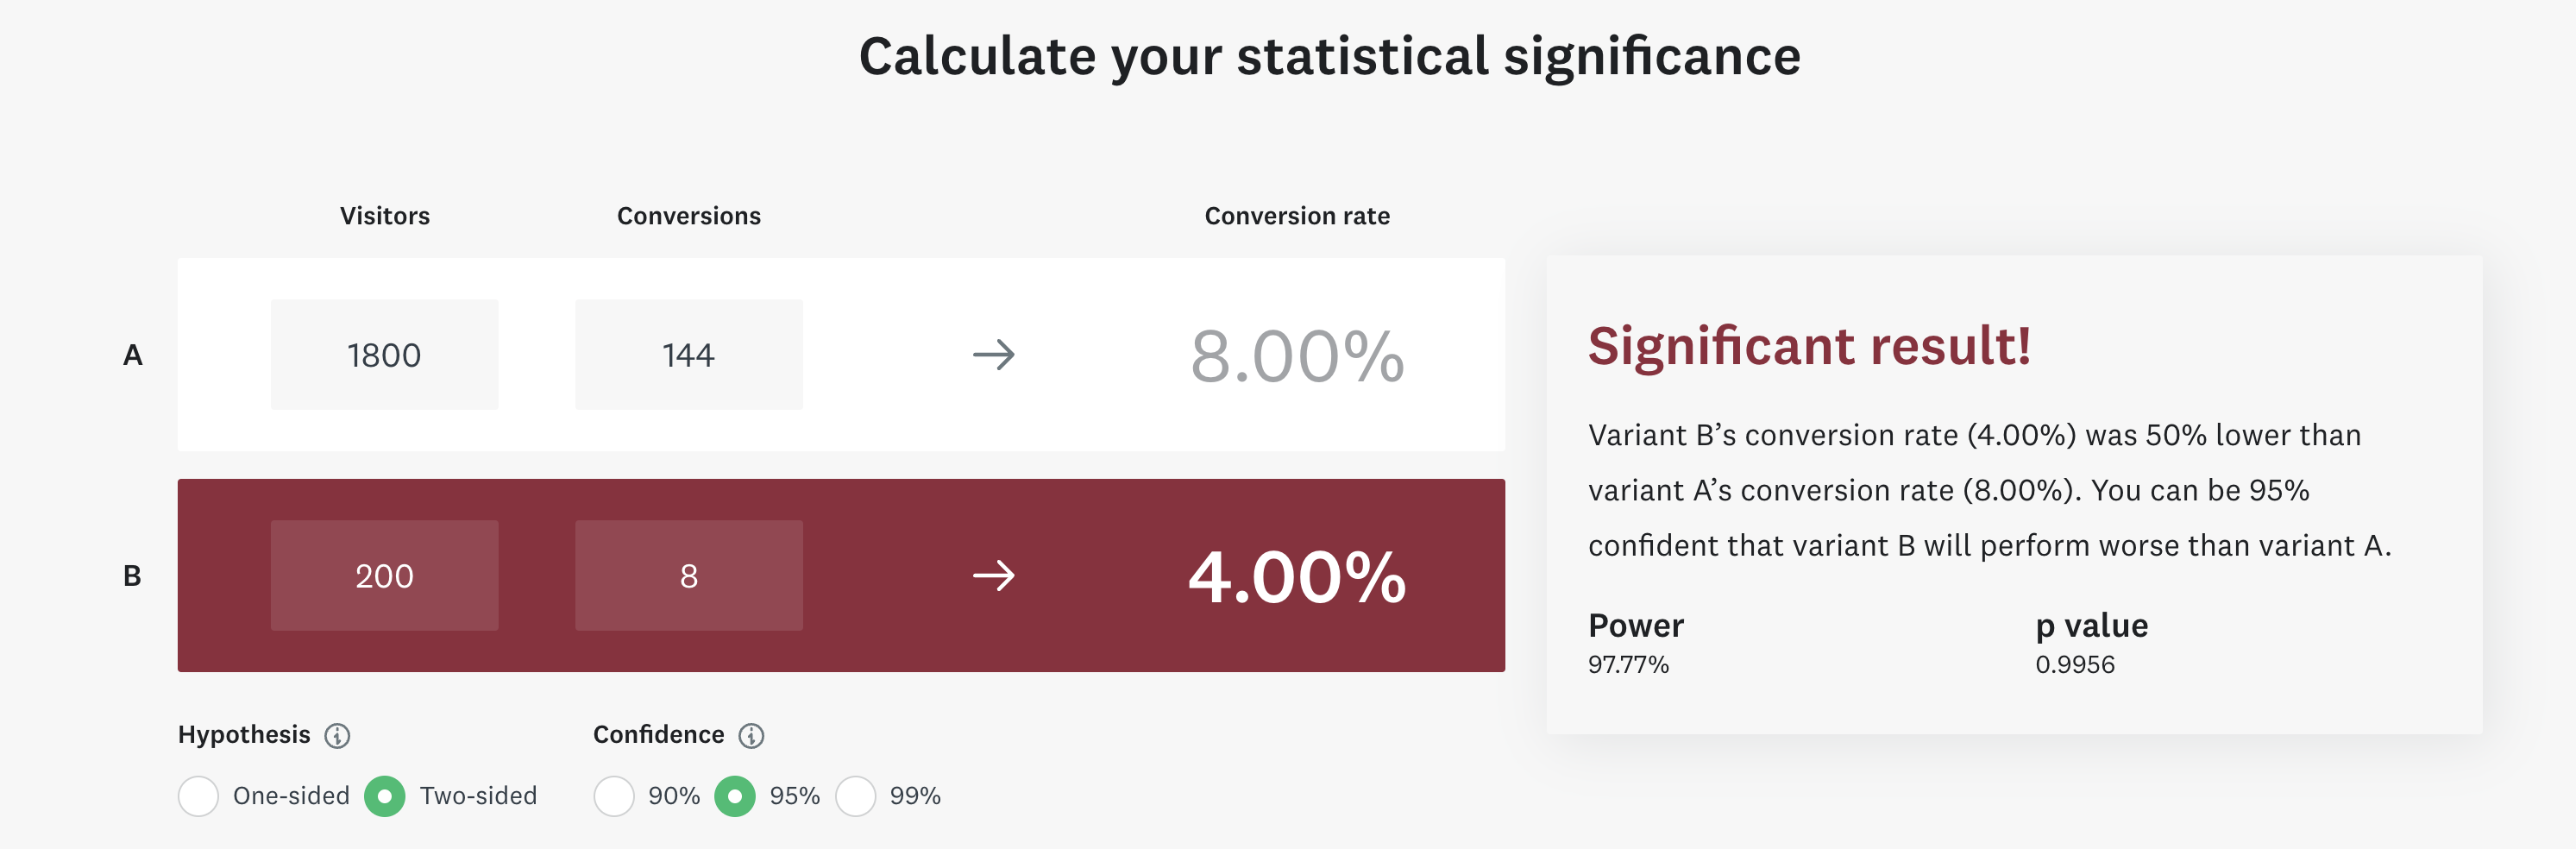
Viola, now the result is statistically significant.
This simply indicates that, to be able to reliably detect a 4% difference (in absolute terms, not relative - which will be uplift), we will need to allocate at least 10% of the population to the control group.
Summary:
If the target group does not deliver more than 4% improvement in absolute terms, we cannot conclude the result is reliable. We will have to conclude that any measured improvement under 4% may have occurred due to random chances. This is because we have assumed the minimum detectable difference to be (8%, in target - 4%, in control) = 4%
If the target group delivers an improvement more than 4%, we will be able to reliably detect the improvement.
We need to start from a smaller sample size and increase until we get a statistically significant result. This will ensure we’re contacting as many customers as possible from the campaign. This will help to financially justify the campaign. Remember, every lead/customer in control group is potentially a lost opportunity.
We often need a few iterations to find the minimum control group size that will deliver a detectable difference between control and target group performance.Often, the minimum logical difference between target and control cannot be altered.Therefore, we need to adjust the control group size.
The target and control group members must be picked randomly from the eligible population. This must be adhered to if you want to see the campaign delivering real results.
Hope this gives you some guidance on target-control splitting in your next campaign design. Please leave a comment if you find any issue or want to make a suggestion, or simply want to connect.